Read our latest water quality report and learn about our new efforts to study water quality in our priority embayments where HABs remain a critical issue.
Share:
The Peconic Estuary, the expansive network of bays and waterways nestled between the North and South Forks, represents the geographic, ecological and cultural heart of the East End.
As a National Estuary Program, the Peconic Estuary Partnership (PEP) developed the 2020 Comprehensive Conservation and Management Plan (CCMP) that identifies four long-term goals. This 2020 Peconic Estuary Annual Water Quality Report tracks whether we are meeting our identified water quality targets to achieve our goals for Peconic Estuary waters. Clean water supports fish, shellfish, and wildlife ecosystem health, provides for safe recreation in and on the water, and seafood that is safe for consumption.
The Peconic Estuary Water Quality Report will enable PEP to track progress on meeting our CCMP goals for Resilient Communities, Clean Waters for Ecosystem Health and Safe Recreation, and Healthy Ecosystem with Abundant, Diverse Wildlife over the next decade.
PEP has set targets for Water Clarity, Chlorophyll-a, Dissolved Oxygen and Pathogens.
Water Quality Monitoring Strategy
PEP finalized The PEP Water Quality Monitoring Strategy in 2021. The Strategy includes a summary of existing water quality monitoring programs and an assessment of whether data collected by those programs can adequately track and detect changes in water quality needed to assess progress towards CCMP Goals. The Strategy also includes Next Steps to address gaps in data and/or information needed to fully assess progress towards CCMP Goals.
Water Quality Monitoring Collaborative
To ensure effective implementation of the PEP Water Quality Monitoring Strategy, the PEP has developed a Peconic Estuary Water Quality Monitoring Collaborative (WQMC) to help advise the completion of the Next Steps from 2020 through 2023 outlined in the Strategy. The Collaborative will function as a sub-committee of the Technical Advisory Committee (TAC) and is composed of main water quality monitoring programs in the Estuary- members of New York State Department of Environmental Conservation (NYSDEC), U.S. Geological Survey (USGS), Suffolk County, Cornell Cooperative Extension (CCE), and academic and non-profit groups. The WQMC utilizes data collected by our partners to evaluate water quality:
The WQMC is using the Peconic R-based open science package developed by the Tampa Bay Estuary Program to analyze and annually report on water quality in the Peconic Estuary.
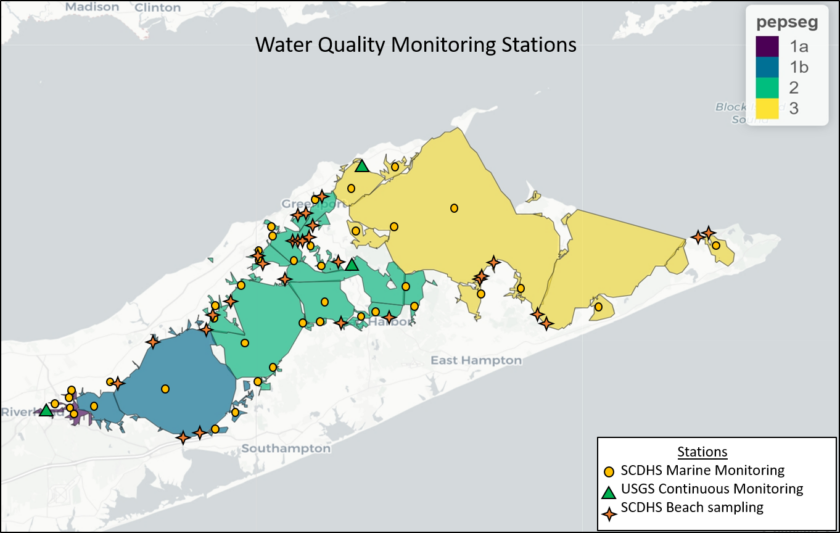
SCDHS and USGS sampling stations. The data collected at these stations is used for the PEP surface water quality monitoring. PEP Segments: 1a: Western/River Influence, 1b: Western, 2: Central and 3: Eastern.
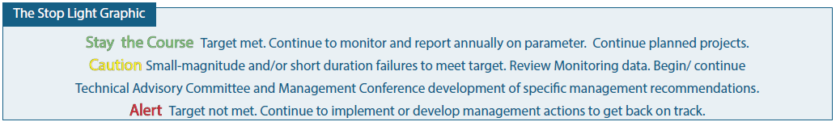
PEP will use Stop Light Graphics to indicate if the target is being met or not, and direct management action for each parameter and segment.
One of the most serious issues affecting water quality in the Peconic Estuary is excess nitrogen loading, which can cause harmful algae blooms, low dissolved oxygen, low light availability, and degraded aquatic habitats. The Report tracks water clarity, chlorophyll-a and dissolved oxygen to measure the impacts of nutrient pollution and our progress.
Water Clarity & Chlorophyll-a
Increased algae blooms correlate with higher chlorophyll-a levels and lower water clarity leading to lower light availability. The duration of time and magnitude of exceedance of water clarity and chlorophyll-a targets are assessed together to track progress toward water quality goals.
Higher water clarity means that more sunlight can reach submerged aquatic vegetation (SAV), such as eelgrass, which need sufficient sunlight in order to grow and survive. SAV provides important habitat for fish, shellfish, and invertebrates. Reduced water clarity can be caused by algal blooms, eroded sediments from runoff, or disturbed bottom sediments from wind or human activities.
The concentration of chlorophyll-a, the pigments in plants that absorb sunlight and facilitate photosynthesis, in the water is an indicator of the amount of algae in the water. Chlorophyll-a measurements can be used as an indirect indicator of algal presence and growth and interfered nutrient levels.
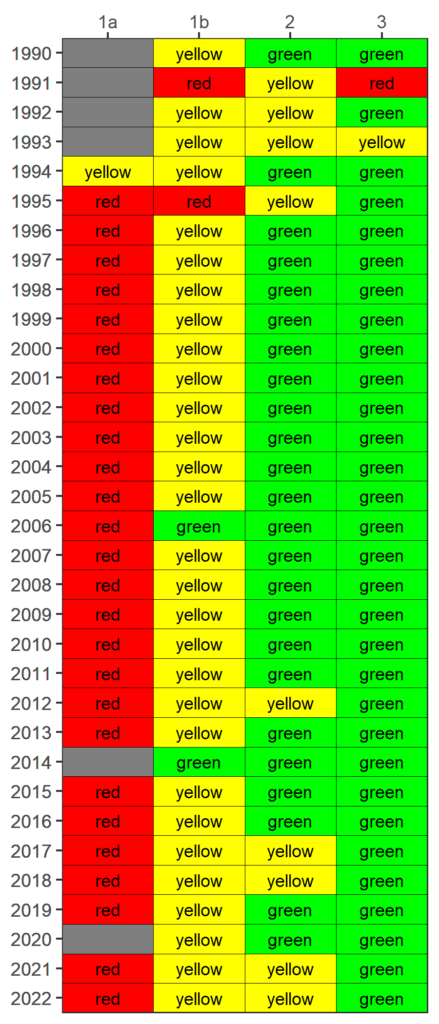
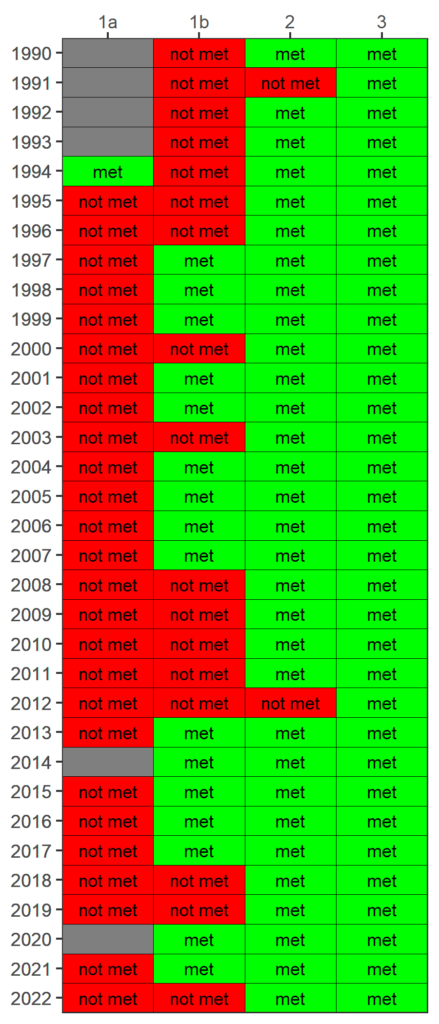
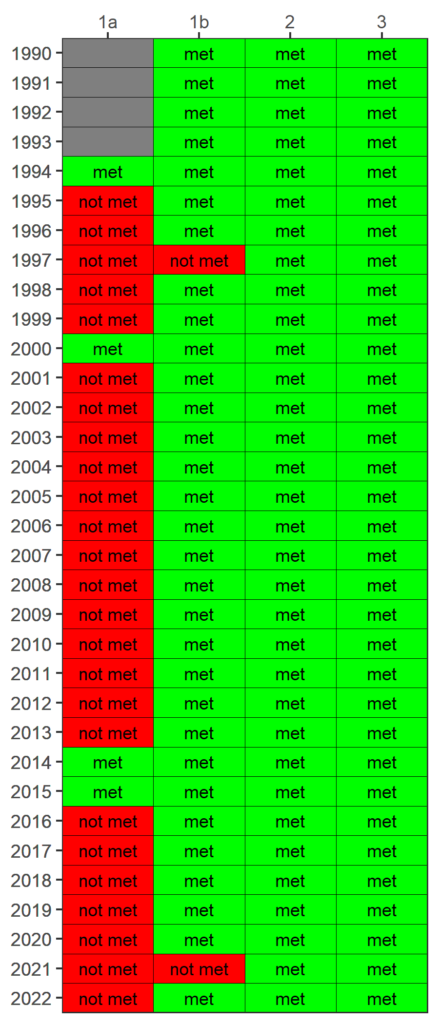
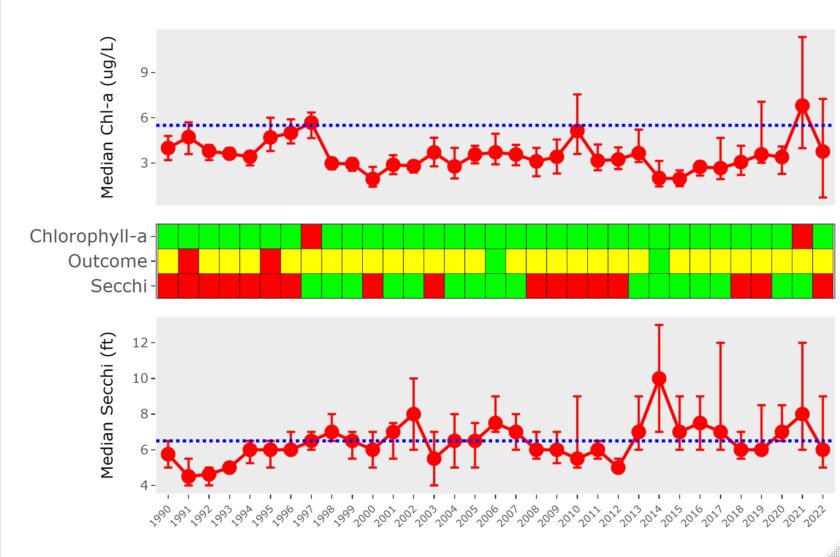
Stop Light Graphic of Combined Water Clarity and Chlorophyll-a at Peconic Estuary SCDHS Stations by Estuary Segment
1990-2022
Segments: 1a-Western-River Influence, 1b-Western, 2-Central and 3-Eastern
The Stop Light Graphic reflects the combined outcomes for chlorophyll-a and water clarity based on analysis of exceedance duration and magnitude of targets for each parameter. Water clarity and Secchi disk depth median values during the growing season at SCDHS stations were averaged within the Estuary segment. Tracking the attainment outcomes provides the framework from which Estuary management actions can be developed and initiated. For each year and segment, a color-coded management action is assigned.
Water Clarity Samples
Water clarity is measured by the depth at which a Secchi disk is visible from the water’s surface at SCDHS marine monitoring stations in the Peconic Estuary. A Secchi disk is a white and black disk that is lowered down into the water - the depth at which the disk is no longer visible is taken as a measure of the how clear the water is. Higher water clarity is signified by greater Secchi disk depths.
The PEP’s target for water clarity: Median Secchi disk depths should be 2 meters (m)/ 6.5 feet (ft) or greater during the April 1 through October 31 growing season.
Water Clarity at SCDHS Stations per Peconic Estuary segment
1990-2022
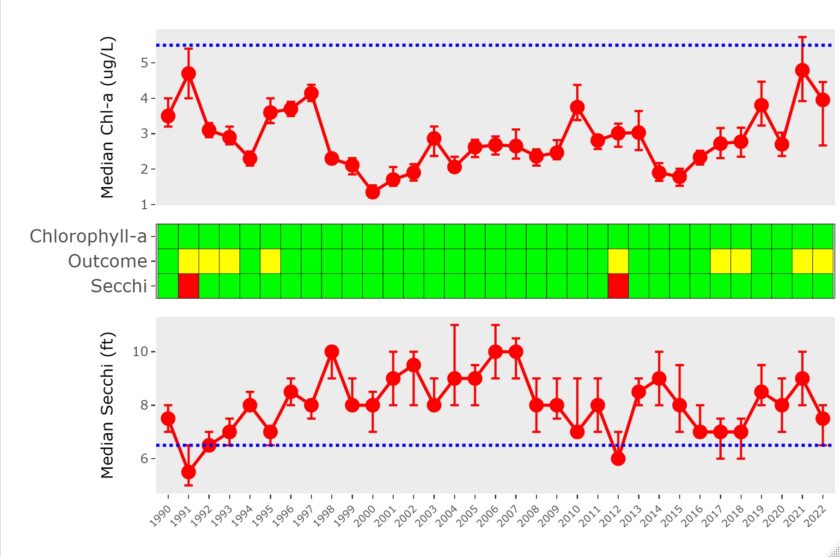
Chlorophyll-a Samples
Chlorophyll-a samples are collected at SCDHS marine monitoring stations in the Peconic Estuary.
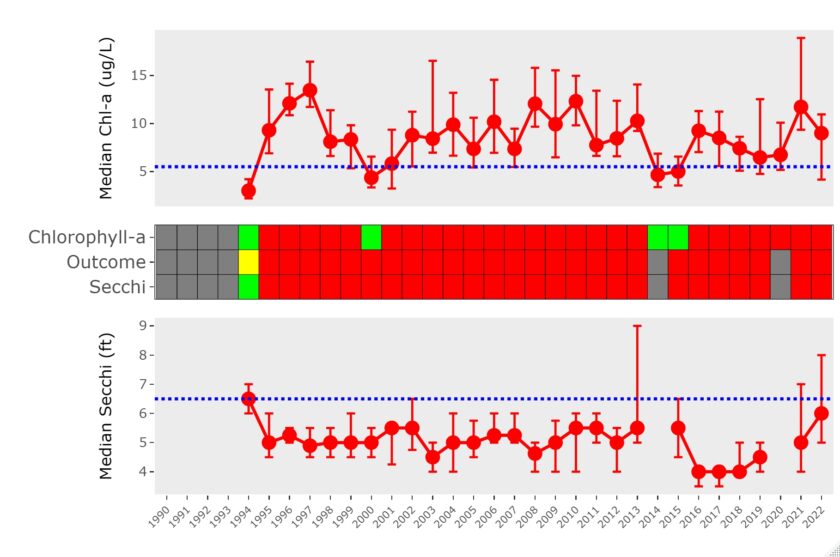
The PEP’s target for chlorophyll-a: Median chlorophyll-a concentrations should be no greater than 5.5 ug/L during the April 1 through October 31 growing season.
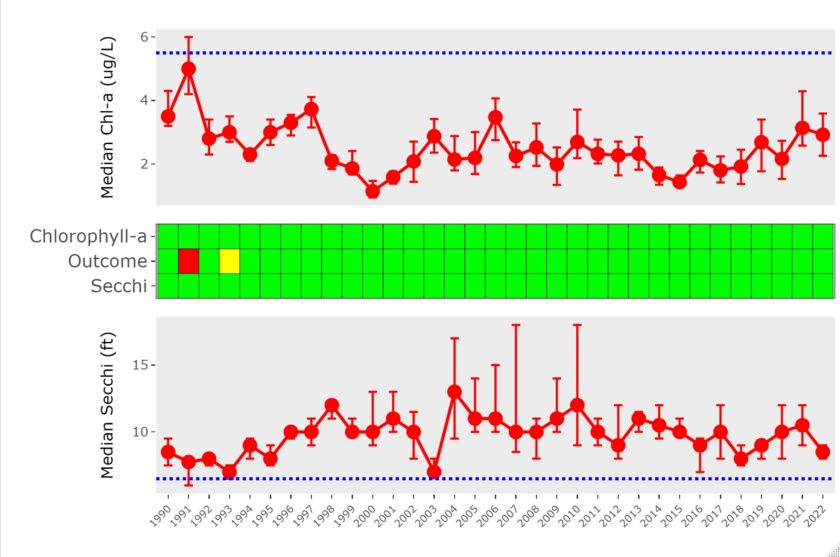
Chlorophyll-a concentrations at SCDHS Stations per Peconic Estuary segment
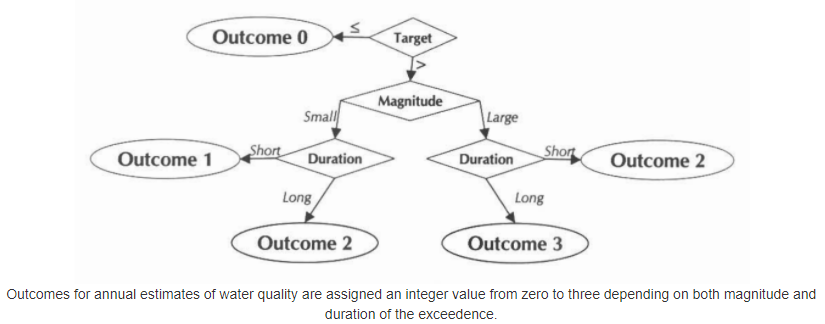
Water clarity and Secchi disk depth median values during the growing season (April 1 through October 31) at SCDHS stations were averaged within the Estuary segment. An outcome integer from zero to three is assigned to each Estuary segment for each annual estimate of chlorophyll-a and secchi depth. These outcomes are based on both the exceedance of the annual estimate above the threshold and duration of the exceedance of the threshold for the years prior. The following graphic describes this process:
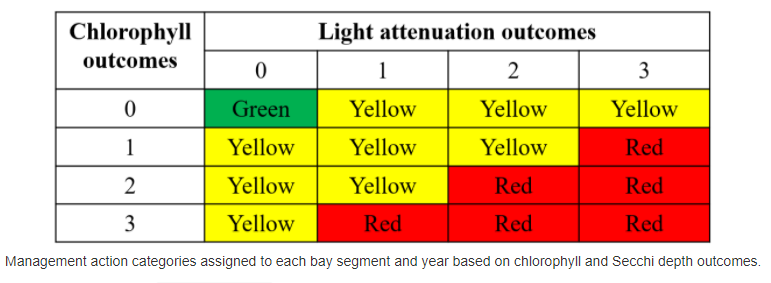
The final Stop Light Graphic created reflects the combined outcomes for chlorophyll-a and secchi depth. Tracking the attainment outcomes provides the framework from which bay management actions can be developed and initiated. For each year and segment, a color-coded management action is assigned, in this analysis secchi depth is used instead of light attenuation values.
See below the median annual chlorophyll-a and secchi disk values in relation to the PEP targets for these parameters and the resulting outcome Stop Light Graphic for each Estuary segment
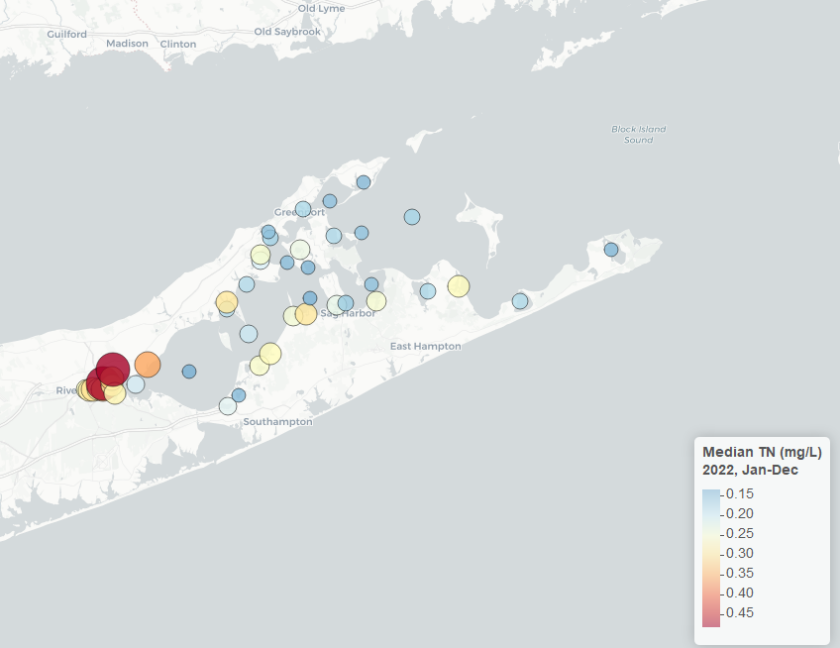
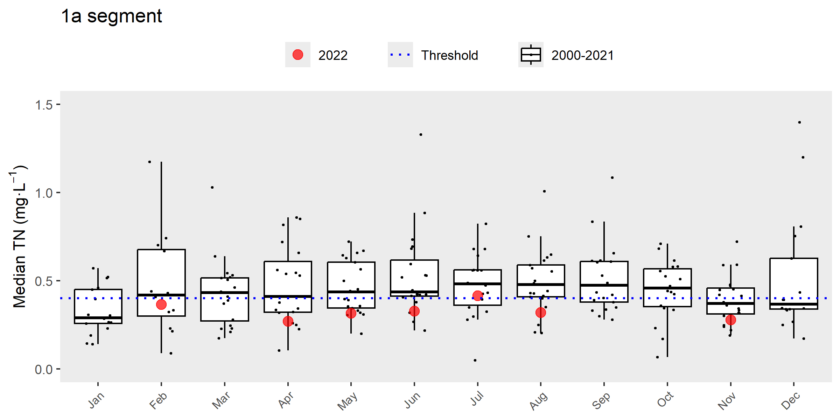
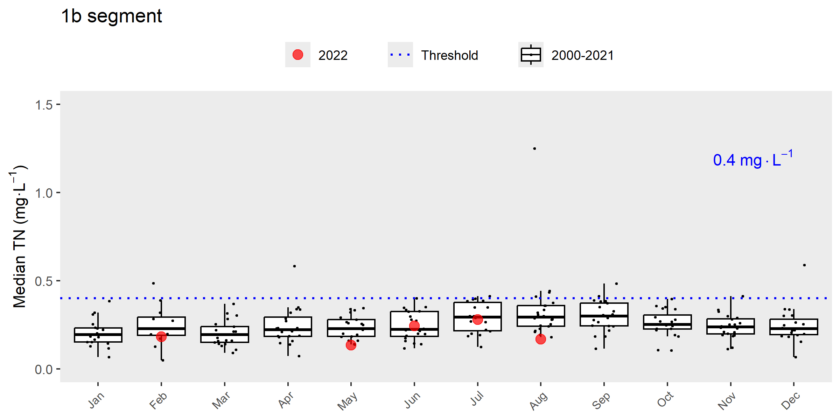
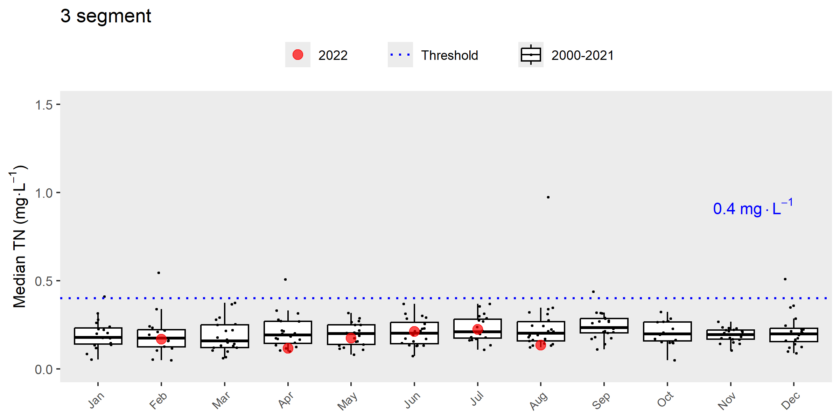
The concentration of total Nitrogen in surface water, which is a vital nutrient for algae and plant metabolism (photosynthesis) is an indicator of the amount of algae in the water, and it has been shown in the scientific literature that it directly correlates with impaired water quality.
Median Total Nitrogen (TN, mg/L) at SCDHS surface water quality stations within the Peconic Estuary for 2022.
Note that Meetinghouse creek and the Sawmill Creek stations are “off the chart” based on the scale presented in the legend (0.95 mg/L and 0.63 mg/L, respectively)
Total Nitrogen Concentrations and Samplings
The United States Environmental Protection Agency’s (EPA) National Coastal Condition Assessment (NCCA) uses 0.40 mg/L as a TN endpoint (threshold), which PEP has adopted. This value is based on the amount of TN in surface waters that would allow current eelgrass populations to survive. If the goal is to restore and recover the eelgrass populations within the estuary, a threshold of 0.30 mg/L is recommended.
Boxplots for the Peconic Estuary segments of Median Total Nitrogen with the data for 2022 highlighted in red
Segments: 1a-Western/River Influcnce, 1b-Western, 2-Central and 3-Eastern
Dissolved Oxygen
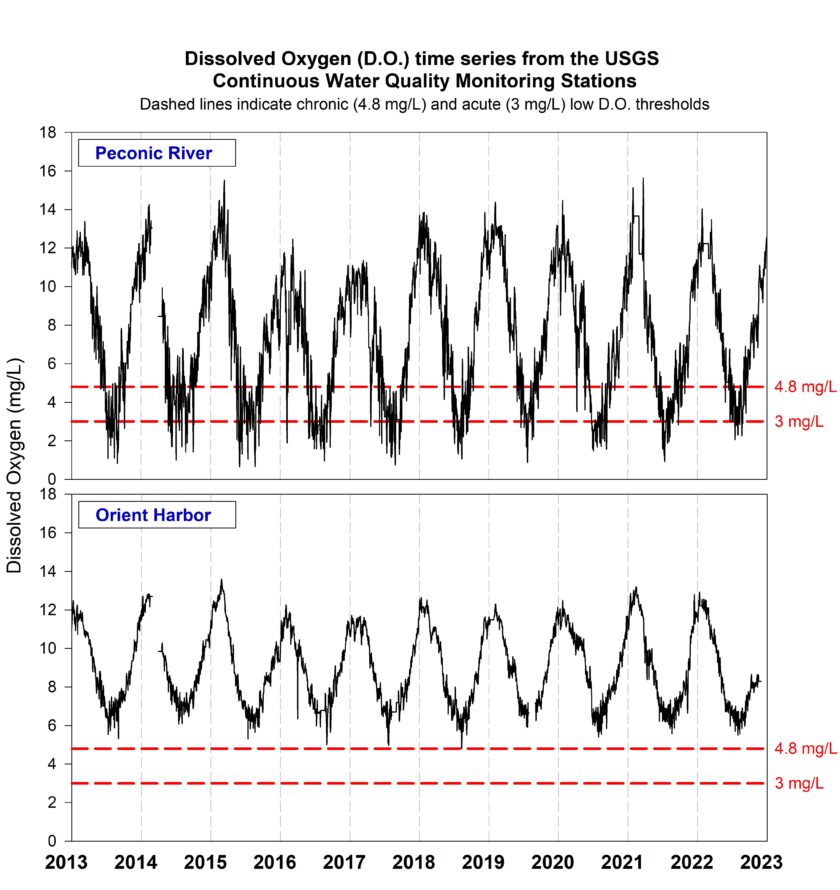
Dissolved Oxygen (DO) in the water column is necessary for fish and other aquatic organisms to live. Concentrations can be impacted by the amount of algae that is in the water column, the associated photosynthesis and decomposition rates, natural variations in temperature, and wave action and mixing.
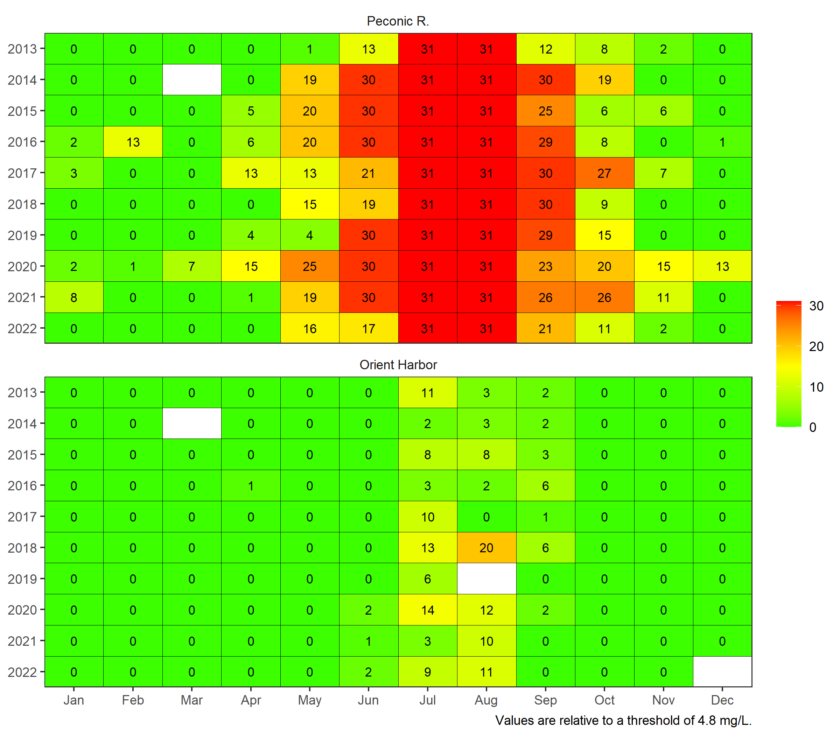
Stop Light Graphic of Maximum Sequential Days Monthly Below DO Concentration Target at Peconic Estuary USGS Stations 2013-2022
The Stop Light Graphic reflects the sequential number of days with a 24-hour mean measurement below 4.8 mg/L at Peconic River and Orient Harbor Stations, which is considered chronic low DO. For each month and station, a color-coded management action is assigned.
Dissolved Oxygen Concentrations
DO concentrations indicate the amount of oxygen available for aquatic organisms in the Peconic Estuary. DO concentrations are measured every 6 minutes at the two USGS Continuous Water Quality Monitoring stations in the Peconic Estuary.
The PEP's target for DO: DO concentrations should comply with New York State's acute (never less than 3 mg/L) and chronic (> 4.8 mg/L as daily average in 90% of measurements) DO criteria.
Methodology
The DO data analysis utilized the USGS OrientHarbor and Riverhead Continuous Water Quality Monitoring Stations data set. More detail on how the analysis was completed using the Peconic R-based open science package can be found here.
The data collected at the Riverhead and Orient Harbor USGS Continuous Water Quality Monitoring Stations are be summarized from the continuous (~6 minute observations) to daily averages. The data was analyzed relative to the chronic threshold of 4.8 mg/L.
Within the R package the average DO concentration for each day is calculated and a 1 (yes) or 0 (no) is assigned to each day based on if the concentration was below the threshold value at any point during a day. Additionally, the R package calculates a cumulative tally of the number of days in each month at which DO fell below the threshold at any point during a day. The data is then summarized by month to be illustrated in the Stop Light Graphics.
The R package calculates average of all daily DO averages across the month, the proportion of days in a month when concentrations in a given day fell below the threshold (1 would mean all days had an instance of DO below the threshold, 0 would mean none), and the maximum number of sequential days in a month when concentrations in a given day fell below the threshold (30 or 31, depending on month, would indicate all days in a month had an instance of DO below the threshold).
The DO data can be summarized differently depending on how hypoxia/anoxia conditions can be described relative to potential impacts on biological resources. Biota may be stressed differently depending on the number of times hypoxia occurs vs how long it may persist. The two measures may indicate similar information, but not always depending on characteristics of the DO time series.
The Stop Light Graphic below shows the maximum number of sequential days in a month when concentrations in a given day fell below the threshold of 4.8 mg/L.
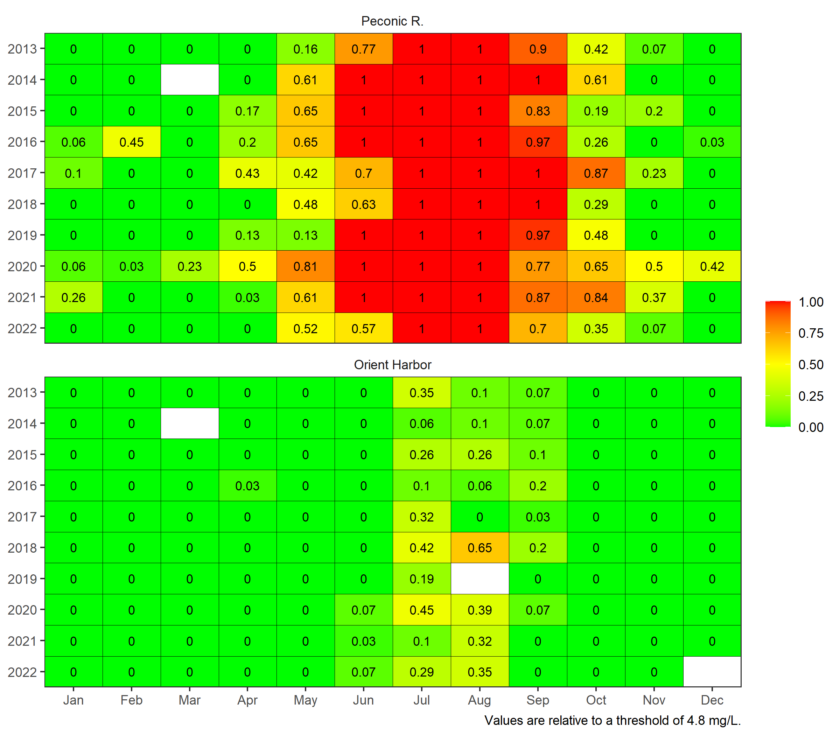
Stop Light Graphic of the Proportion of Days Monthly Below DO Concentration Target of 4.8 mg/L at Peconic Estuary USGS Stations
2013-2022
The Stop Light Graphic below shows the proportion of days in a month when concentrations in a given day fell below a threshold of 4.8 mg/L.
Stop Light Graphic of the Proportion of Days Monthly Below DO Concentration Target of 4.8 mg/L at Peconic Estuary USGS Stations
2013-2022
Using the same methodology, the data collected at the Riverhead and Orient Harbor USGS Continuous Water Quality Monitoring Stations can also be analyzed relative to the acute threshold of 3 mg/L.
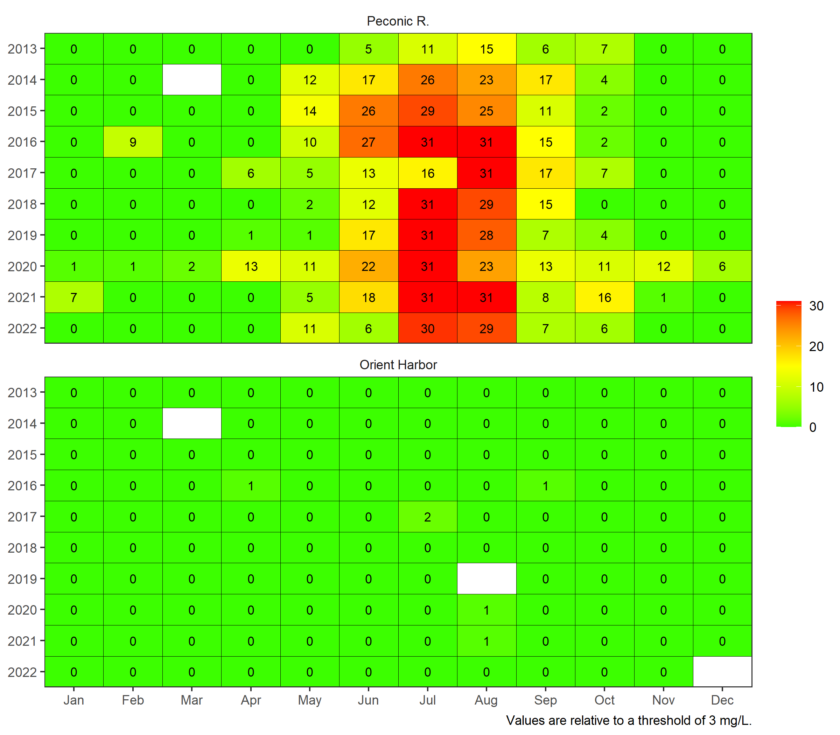
The Stop Light Graphic below shows the maximum number of sequential days in a month when concentrations in a given day fell below the threshold of 3 mg/L.
Stop Light Graphic of the Proportion of Days Monthly Below DO Concentration Target of 3 mg/L at Peconic Estuary USGS Stations
2013-2022
The Stop Light Graphic below shows the proportion of days in a month when concentrations in a given day fell below a threshold of 3 mg/L.
Stop Light Graphic of the Proportion of Days Monthly Below DO Concentration Target of 3 mg/L at Peconic Estuary USGS Stations
2013-2022
Pathogens
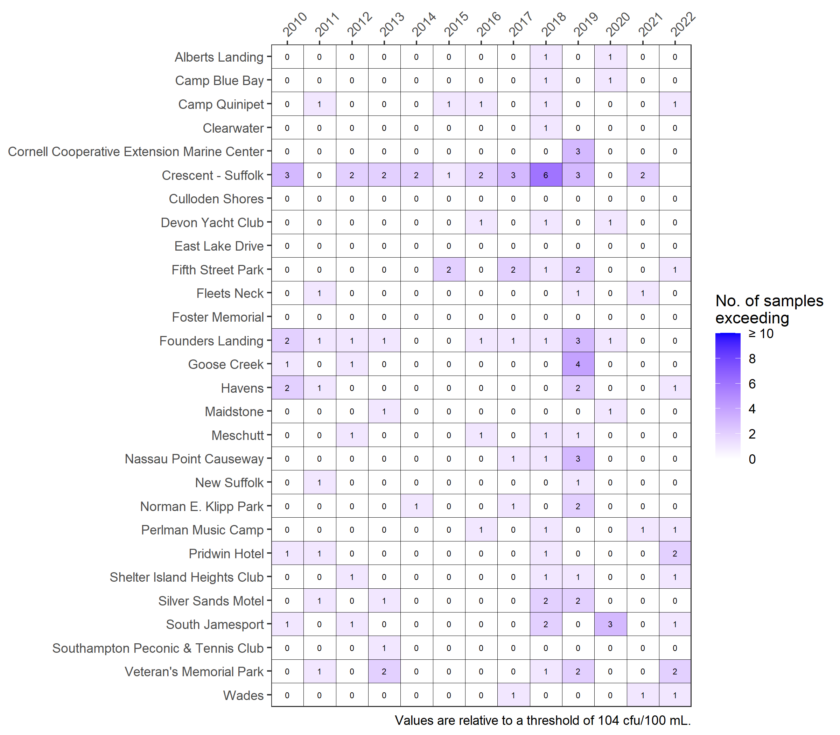
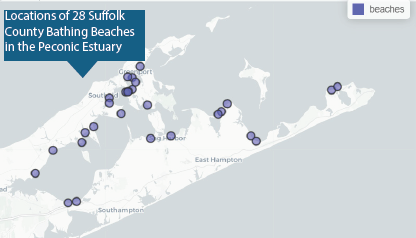
Pathogen Exposure Risk at Suffolk County Bathing Beaches in the Peconic Estuary 2010 -2022
Number of Samples that Exceeded Enterococcus Counts of 104 cfu/100 mL within 24 Hours at Bathing Beaches.
Pathogens are viruses, bacteria, fungi, and protozoans that cause diseases in humans, other animals or plants. It is difficult to directly measure the concentration of specific pathogens in sea water due to the variable nature of their occurrence. Instead, the potential for the presence of human pathogens in the water is measured using bacterial indicator species. Fecal indicator bacteria, total and fecal coliform bacteria, originate in the intestines of warm-blooded animals. Their presence in the water indicates that the waste of a warm-blooded animal, which may include pathogens, has entered the water. A type of fecal indicator bacteria that is monitored at the Suffolk County bathing beaches in the Peconic Estuary is Enterococcus bacteria.
Target Counts for Pathogens
The PEP’s target for pathogens: Enterococcus counts at estuarine/marine swimming beaches should not exceed 104 colony forming units per 100 milliliter water sample (104 cfu/100mL).
There were 9 occurrences of bathing beaches exceeding the criteria regarding acceptable levels of Enterococci adopted by the NYS Health Department (104 cfu/100mL) at least one time in 2022. The Suffolk County Bathing beaches in the Peconic Estuary are overall very clean.
Note: The beaches represented in the Report are only those beaches that are monitored by the SCDHS as part of the Bathing Beach Monitoring Program.
The Suffolk County bathing beaches in the watershed are Tier 2 and Tier 3 beaches- meaning the beaches have a moderate to low relative risk associated with their use.
Note: Monitoring of Coliform bacteria and classification of shellfish growing areas is conducted by the NYS DEC, Division of Marine Resources Shellfish Sanitation Unit to routinely monitor the presence of pathogens. The NYSDEC Public Shellfish Mapper classifies shellfish growing areas as certified (open) or uncertified (closed) based on the results of the surveys that information is not represented in this Report. .
Methodology
Regular monitoring of swimming beach pathogens is conducted by Suffolk County Department of Health Services (SCDHS). Water quality at swimming beaches can be adversely affected by episodic sources such as stormwater runoff, wastewater discharges from boats or land-based septic systems, and fecal material from pets and wildlife. To provide information on the potential presence of pathogens in public swimming areas that may be impacted by such contamination, the SCDHS conducts a comprehensive bathing beach water quality monitoring program from May through September each year. Sampling is performed by SCDHS staff, with analyses conducted by the Department’s accredited Public and Environmental Health Laboratory (PEHL).
Information from this monitoring program has been summarized using the R package to communicate the relative risk of exposure to pathogens at bathing beaches in the Peconic Estuary.
The SCDHS data includes concentrations of Enterococcus bacteria as cfu/100 mL for swimming beaches in Suffolk County. The data was used to count the number of instances at each beach when concentrations were above 104 cfu/ml. Although this does not mean a beach was closed, relative exceedances provide a coarse measure of potential risk of exposure to harmful pathogens.
The estimated exposure risk was analyzed by counting the number of instances in a year when concentrations at a beach exceeded the threshold for each 24 hour period in the dataset. The result is an annual reporting matrix for the relative risk of pathogen exposure at 28 selected beaches in the Peconic Estuary. Tracking the number of exceedances of bacterial concentrations provides a framework for identifying locations that may need management actions to remediate potential public health issues.
Harmful Algal Blooms
A Harmful Algal Bloom (HAB) is a small subset of algal species – including diatom, dinoflagellate and cyanobacterial blooms – that produce toxins and/or grow excessively to high cell concentrations, harming humans, other animals and the environment.
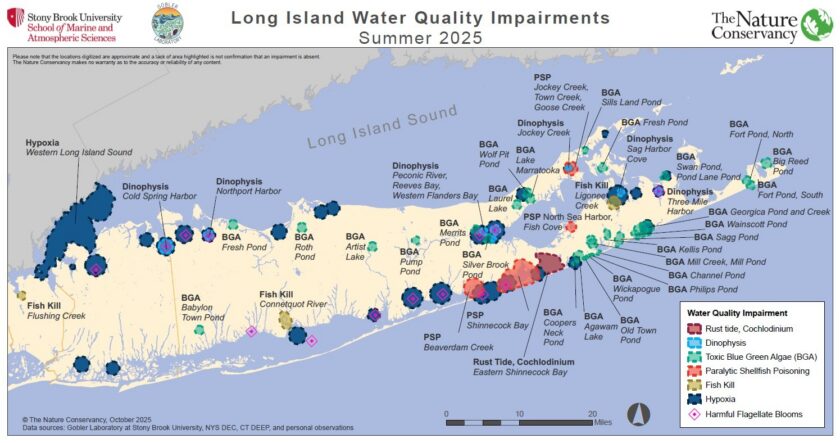
Suffolk County conducts seasonal HAB monitoring in conjunction with several partners, NYSDEC and The Gobler Lab at Stony Brook University. The PEP has committed to tracking and reporting on harmful algal blooms on an annual basis as the adoption of numerical targets are not currently anticipated for this parameter. See Long Island Water Quality Impairments, Summer 2020 map, which illustrates where HABs were recorded during the season as tracked by our partners.
The areas labeled Rust Tide on the map signify that the phytoplankton species Cochlodinium polykrikoides was present in significant numbers. The areas labeled Mahogany Tide signify that the phytoplankton species Prorocentrum minimum was present in significant numbers. The areas labeled Toxic Blue Green Algae on the map signify that the microscopic organisms Cyanobacteria sp. were present in significant numbers.
Note: The boundaries in this map are approximate, it should not be assumed that each occurrence covers 100% of the area delineated.
Types of HABs
Rust Tide- A HAB observed in marine waters. Rust tide poses no effect on humans. A severe rust tide may harm fish and shellfish because it produces a hydrogen peroxide-like compound that can damage gill tissue, juvenile fish and shellfish seem especially susceptible to gill damage from rust tide blooms. A harmful secondary effect of is reduced DO levels in the water as the HAB cells die, sink to the bottom and are consumed by bacteria which may take up available oxygen.
Mahogany Tide- A HAB observed in marine waters. Mahogany tide poses no effect on humans and no direct threat to fish and invertebrates. The main concern is that it can bloom for long periods of time and in dense enough concentrations to harm seagrasses by blocking out the sunlight they need to survive. The secondary effect of reduced DO levels in the water is an additional concern.
Toxic Blue Green Algae- A HAB seen in marine and freshwaters. Many cyanobacteria blooms produce neurotoxins or hepatotoxins that can harm, or even kill zooplankton, fish, shellfish, marine mammals, humans and pets. Toxic blue green algae blooms have caused hypoxia (DO below 2-3mg/L) and anoxia (DO at 0mg/L)), contributing to fish kills, foul odors and contact dermatitis in humans after recreational contact.
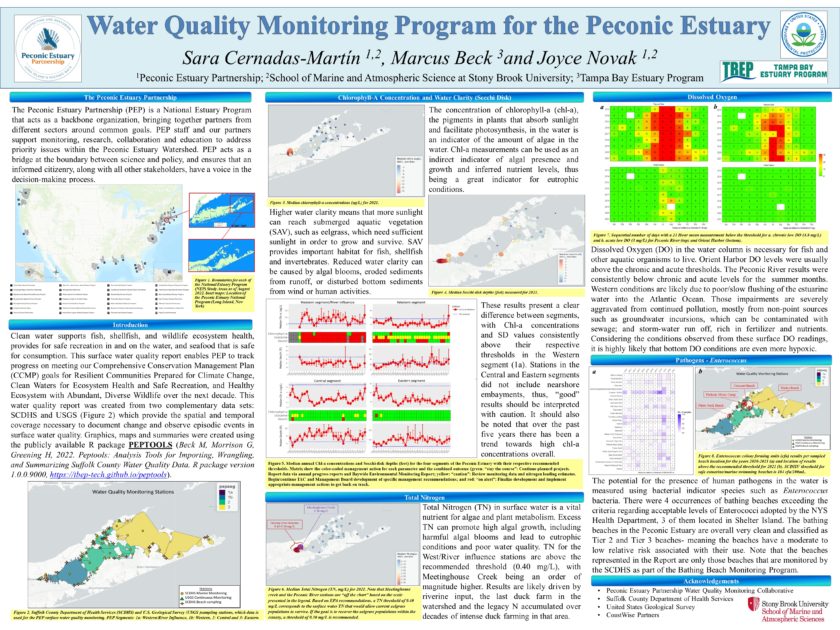
Water Quality Summary for 2021, Poster presented at the Restore America’s Estuaries conference in December 2022