Live Nitrogen Reduction Tracker

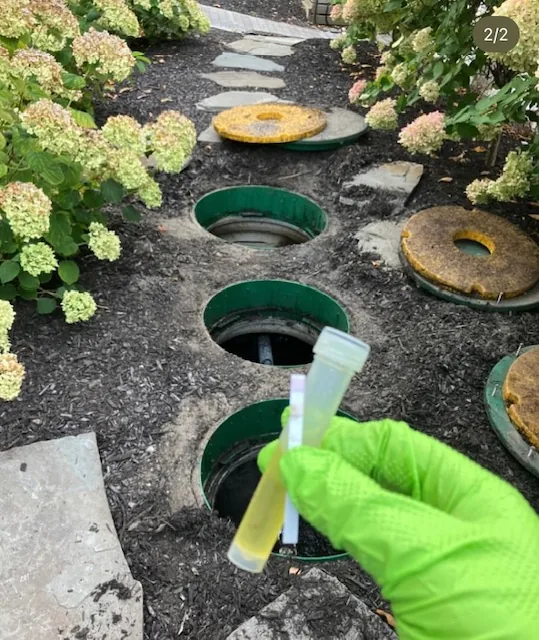
Innovative/Alternative septic system installation. Photo courtesy of Advanced Wastewater Solutions

Live Nitrogen Reduction Tracker

Live nitrogen counter
0.000

pounds of nitrogen kept out of the Peconic Estuary since 2017

This number counts up live, second by second, as upgraded septic systems keep removing nitrogen.

0septic systems upgraded, as of July 14, 2026
0pounds of nitrogen removed every year
0pounds added to the total every day
21.3pounds removed per upgraded system, per year

How the total has grown

Total pounds of nitrogen kept out of the water by the end of each fiscal year (October to September).

Where upgrades are happening

Grant-funded septic upgrades by town, September 2017 through July 2026. Showing towns inside the Peconic Estuary watershed. Tap or hover over a town for details.

Peconic Estuary watershedFewer to more upgrades
Show as a list

How it is calculated

The Peconic Estuary Partnership uses this method to report nitrogen reductions to the U.S. Environmental Protection Agency.

30 lbsof nitrogen per household each year (about 10 lbs per person, 3 people per home)
71% lessAn old system releases about 65 mg/L of nitrogen. An upgraded system releases 19 mg/L or less.
21.3 lbsremoved per upgraded system each year (71% of 30 lbs)
Every dayEach system keeps working year after year, so the total keeps growing.
Systems upgraded × 21.3 lbs × years in service = pounds of nitrogen kept out
  • These are estimates. They assume every system has worked continuously since it was installed.
  • Businesses and other non-residential systems are counted at the household rate, so the real total is likely higher.
  • The counter counts up live on its own. The number of upgraded systems is updated once or twice a year, when Suffolk County shares new installation records.

Source: grant-funded installations from the Suffolk County Department of Health Services.