Protecting & Restoring Long Island's Peconic Bays
PEP works with a number of partners to monitor the condition of water quality and essential habitats in the Peconic Estuary.
Water Quality Monitoring>>>
Atmospheric Deposition Monitoring>>>
Eelgrass Monitoring>>>
Salt Marsh Surface Elevation Table (SET) Monitoring>>>
Horseshoe Crab Survey
Alewife Monitoring Program
River Herring and Eel Survey
Peconic Estuary Trawl Survey
Water quality monitoring is essential in order to assess the health of the Peconic Estuary and to help determine if management goals are being reached. The Peconic Estuary Partnership supports both a year-round long-term periodic sampling program conducted by the Suffolk County Department of Health Services (SCDHS) Office of Ecology, Bureau of Marine Resources and a continuous sampling program conducted by the United States Geological Survey (USGS). These two water quality sampling programs complement each other and together provide a great resource for understanding the Peconic Estuary.
SCDHS’s water quality sampling provides excellent spatial coverage of the estuary and its freshwater tributaries and the high frequency data collected at the USGS continuous monitoring stations provide excellent temporal coverage at two sites.
Monitoring is essential in order to assess the health of the Peconic Estuary and to help determine if management goals are being reached.
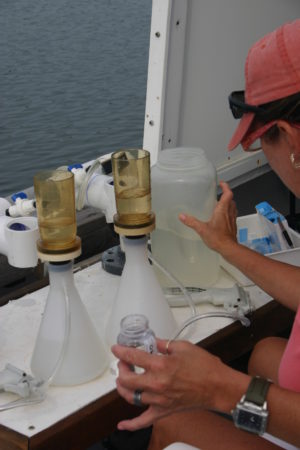
Suffolk County Bureau of Marine Resources has routinely monitored the water quality of surface and marine waters in the Peconic Estuary since 1977. On a monthly basis, 38 marine locations in main bays and peripheral embayments, and an additional 26 stream and point source sites in the Peconic Estuary are sampled from boats or from shore to assess status of the Peconic Estuary. These data are sufficient to document seasonal variability and trends in the waterbodies being measured.
Sampling of marine and fresh surface waters, and a number of area point sources (STPs), was initially conducted by the Suffolk County Bureau of Marine Resources (BMR) in 1976 under the federally funded Long Island Comprehensive Waste Treatment Management Plan (LI 208 Study). Monitoring efforts have continued since that time, but have varied in frequency, the degree of spatial extent and the parameters analyzed, depending on the needs of existing programs and available resources.
Sampling analytes at marine stations include total and dissolved nitrogen and phosphorus, dissolved inorganic nitrogen (nitrate, nitrite and ammonia), dissolved ortho-phosphate, total and fecal coliform bacteria, total suspended solids, chlorophyll-a, and the brown tide organism Aureococcus anophagefferens. Physical measurements taken include salinity, temperature, dissolved oxygen, pH, light (PAR) attenuation and secchi depth. Fresh water samples are also analyzed for dissolved metals and numerous organic constituents, including volatile organic compounds, semi-volatile organic compounds, pesticides and herbicide compounds.
All Suffolk County Department of Health Services Water Quality Data and Information is available here.
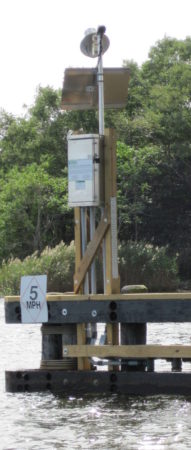
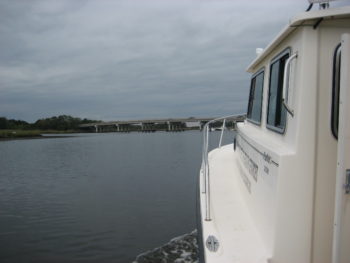
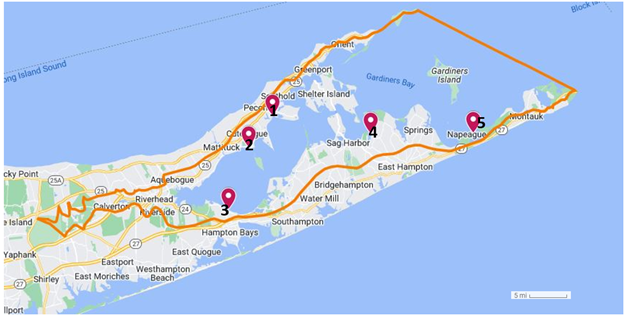
The Peconic Estuary Partnership and Suffolk County partnered with the United States Geological Survey (USGS) to install three continuous monitoring stations in the Peconic Estuary, one is located at the mouth of the Peconic River under the County Road 105 bridge in Riverhead, one is on the South-shore of Shelter Island, and one is in Orient Harbor. These three monitoring stations complement the periodic sampling conducted by SCDHS by providing continuous sampling of the water quality conditions within the estuary.
At 6 minute intervals, ocean and estuary elevation, water temperature, specific conductivity, salinity, dissolved oxygen, turbidity, chlorophyll, sampling depth and pH are measured. A nitrate analyzer measures nitrate in the water column every 30 minutes.
High frequency measurements of key water quality parameters allow long-term trend assessment of climate and other incremental changes. Moreover, estimates of frequency, severity, and duration of hypoxia (low oxygen conditions) and anoxia (zero oxygen conditions) have been collected using the two USGS continuous monitoring stations since 2012. This information was particularly helpful to figure out the reasons for the 2015 fish kill in the
Peconic River because the dissolved oxygen concentrations were recorded every 6 minutes and captured the times when dissolved oxygen was at levels too low to sustain aquatic life.
All USGS data is publically available in near-real-time and posted on the USGS website:
USGS Continuous Monitoring at Riverhead, NY
USGS Continuous Monitoring at Orient, NY
USGS Continuous Monitoring on Shelter Island, NY
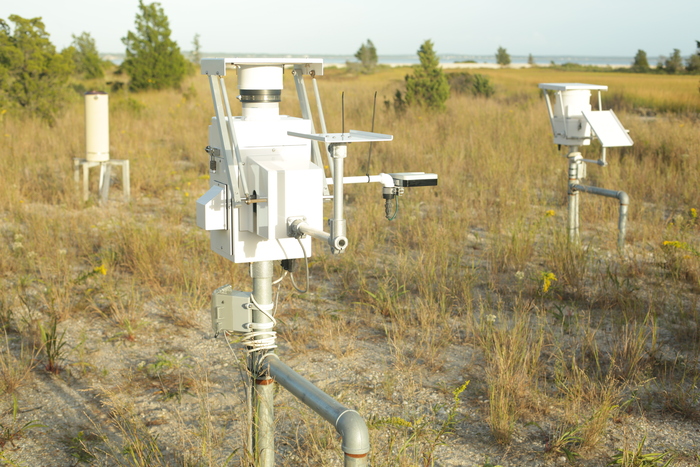
Nitrogen cycles from the air to the land and water through atmospheric deposition. Since 2003, the Peconic Estuary Partnership has been monitoring the atmospheric deposition of nitrogen in the Peconic Estuary watershed, through our participation in the National Atmospheric Deposition Program. The program collects data and trends about the deposition of Ammonia (NH3), a gas readily released into the air from a variety of biological sources, as well as from industrial and combustion processes, and other components in precipitation. This monitoring is essential to understanding the amount of nitrogen entering the estuary through atmospheric deposition and helps inform nitrogen management policies and goals.
Conducted by Suffolk County Department of Health Service Bureau of Marine Resources. Weekly monitoring at the National Atmospheric Deposition Program (NADP) rain and atmospheric deposition gauge at Cedar Beach, Southold, NY.
National Atmospheric Deposition Program Station Data and Information
PEP works with several partners to monitor the condition of essential habitats in the Peconic Estuary.
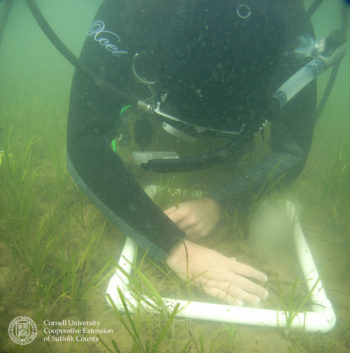
Since 1997,Cornell Cooperative Extension of Suffolk County has monitored of eelgrass survival and bed expansion resulting from previous habitat restoration efforts. Long-term measurements of seagrass extent and deep edge location at historical sites, measurements of light, temperature, and sediment conditions at these sites have been documented and the Peconic Estuary Partnership Long-Term Eelgrass Monitoring Program (PEP LTEMP) report has been produced every year. CCE has conducted long-term monitoring at thirteen sites within the Peconic Estuary. Nine of those sites are monitored annually, and four of those sites, that no longer support eelgrass, are monitored every 2-3 years. In 2023, the PEP Technical Advisory Committee voted to reassess monitoring efforts to align with regional efforts. Historical data collected since 1997 is currently being organized and archived in an online interactive tool.
Eelgrass monitoring program measures: water temperature, sediment samples (lab analysis for percent organic content), fauna counts, light measurement, salinity, macroalgal percent cover and identification, eelgrass bed aerial extent, eelgrass shoot density. Additionally, temperature and light loggers are deployed for extended periods of continuous sampling during the growing season.
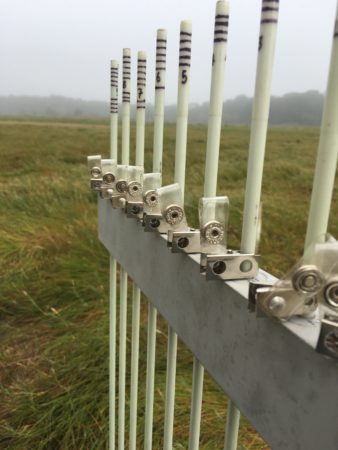
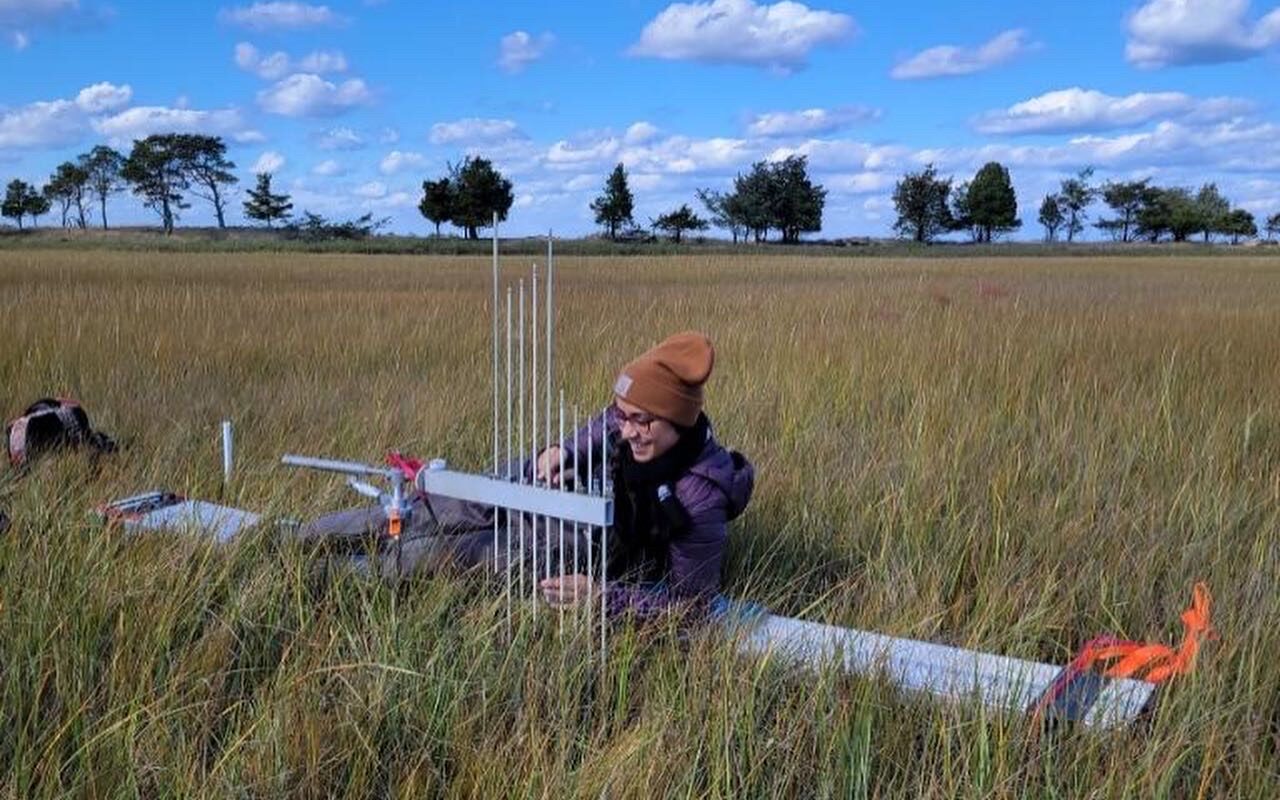
Peconic Estuary Partnership measures the surface elevation of the salt marsh at Indian Island County Park, Hubbard County Park, and Cedar Beach of Southold Town. There are multiple elevation tables at each site that measure marsh accretion or subsidence, natural processes that are influenced by sea-level rise, changes in sediment loading, increasing temperatures, and other consequences of climate change.
Monitoring is conducted annually, with data contributing to local and regional understanding of the status and future of salt marsh systems in a changing world.
The Surface Elevation Table (SET) is a portable mechanical leveling device for measuring the relative elevation change of wetland sediments. SET monitoring measures the degree of accretion or subsidence on the marsh surface through relative elevation data. Learn more about this protocol here.
Cornell Cooperative Extension of Suffolk County, Stony Brook University, and PEP work annually with New York State Department of Environmental Conservation to coordinate and implement the New York Horseshoe Crab Monitoring Network. Horseshoe crabs have been estimated to be almost 450 million years old and have evolved and changed very little during that time. Horseshoe crabs play an important role in the marine food web, producing eggs that are an essential energy source for migrating shorebirds such as the Red knot. Research on horseshoe crab anatomy and physiology has allowed scientists to learn more about a variety of topics impacting everything from human health to space travel. Horseshoe crabs play a vital role in the biomedical industry. The bright-blue blood of the horseshoe crab contains a protein called Limulus Amebocyte Lysate (LAL) and is used by pharmaceutical and medical device manufacturers to test their products for the presence of endotoxins and bacterial substances that can cause fevers and even be fatal to humans. The horseshoe crab survey is one of PEP’s many Citizen Science activities that engages the public in habitat restoration and wildlife projects thereby increasing the public’s understanding of the importance of Peconic Estuary Watershed and bolsters support for habitat and wildlife restoration and protection efforts. Every year PEP trains volunteers who participate in monitoring Horseshoe Crab populations in the Peconic Estuary Watershed. The annual horseshoe crab monitoring survey is essential to assessing the status of horseshoe crabs in New York’s Marine District, and to assist with the regional management and conservation of this important species through the Atlantic States Marine Fisheries Commission.
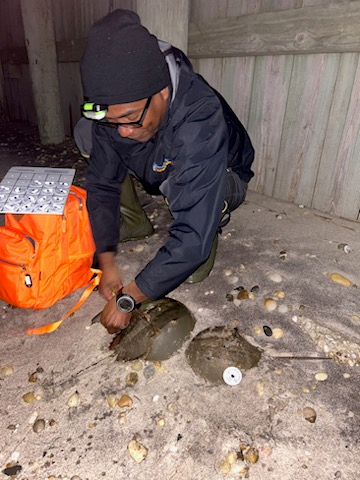
The Horseshoe Crab Monitoring program measures: spawning abundance, size, sex, shell condition, number of tagged and tag returns around full and new moon events in May, June and July. Additionally, environmental parameters, air and water temperature, wind speed, sea state, cloud cover and tide cycle are recorded every survey night.
To volunteer for the horseshoe crab surveys, email Barry Volson at barry.volson@stonybrook.edu
Over the last several decades, PEP has been diligently working with its partners to restore historic critical freshwater spawning and maturation habitat for diadromous fish in the Peconic Estuary Watershed. Through the installation of fish passage structures and replacing undersized road culverts with larger, fish friendly culverts, PEP and partners have provided several ways for alewife and American eel to go around or over the dams to reach critical spawning habitat. The two largest alewife spawning runs on Long Island occur in the Peconic Estuary Watershed. Alewife monitoring at Grangebel Park, the mouth of the Peconic River, has been carried out annually since 2018 by volunteer partners at Suffolk County Community College. Grangebel Dam was the first barrier on the main stem of the Peconic River and the first one to have a fish passage built on it. Construction of the Grangebel Nature-Like Fishway, opened up 1.5 miles of river and 25 acres of diadromous spawning and maturation habitat at the start of the Peconic River. Thousands of alewives use the fishway each year and annual video monitoring of diadromous fish at Grangebel Nature-Like Fishway is in its fourth consecutive year and PIT tagging, its third consecutive year. This data will be provided to the New York Department of Environmental Conservation and the Atlantic States Marine Fisheries Commission to aid in stock assessments and the management of alewife.
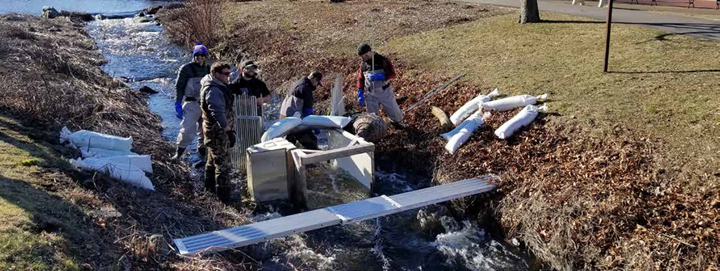
PEP’S annual alewife monitoring at Grangebel is conducted in three ways, 1) Visual counts are conducted by trained volunteers/interns, they inspect or watch a site for fixed durations of time and then make an estimate of how many fish are present. 2) Video counts are obtained from recorded video footage retrieved/downloaded at least twice per week and analyzed by trained PEP interns who identify and count the alewife and 3) Biological monitoring data is collected from adult alewife caught by cast nets, dip nets or hand harvesting. Alewife are measured, sex, and scales are retrieved for age determination, after measurements are made the alewife are released. A subset of fish (up to 300/year) are given Passive Integrated Transponder (PIT) tags just under their skin. The PIT tag gives an alewife a unique identifier thereby allowing its migration to be logged when the alewife travels near receiver PIT tag antennas throughout the Peconic Estuary Watershed. The PIT tag provides a correction factor for the double counting that is associated with some alewives that circle back between the lower reaches of the Peconic River and upstream spawning ground habitat.
Until recently, the Peconic River had six dams along its length that prevented diadromous fish species from migrating up and downstream. Currently, four out of the six dams have had fish passages built, restoring over three hundred acres of diadromous fish habitat on the Peconic River. The installation of fish passages supports the restoration of access to freshwater spawning habitat for diadromous fish populations in the Peconic River and tributaries. Restoring and strengthening ecosystem services, fish and wildlife of the Peconic Estuary will benefit from access to critical habitat, increased biodiversity and restoration of historic food webs. PEP and partners can accurately track alewife abundance in the Peconic River, evaluate the success of fish passage restoration efforts and guide management of the species.
The Long Island Volunteer River Herring and Eel Survey is led by Seatuck and was started in 2006 with partners PEP, Long Island Sound Study and South Shore Estuary Reserve and it is the longest running community science project on Long Island. PEP leads this citizen science initiative throughout the Peconic Estuary Watershed to identify potential additional alewife habitat. This monitoring is critical and important to PEP and partners as the observations validate which runs are viable and are likely to benefit from financial investment on fish passages for spawning habitat restoration. During the annual survey volunteers are trained by PEP, using River herring and Eel Survey Protocol, to survey local waterways in the Peconic Estuary Watershed from mid-March through mid-May. The survey engages community volunteer scientists to monitor historical runs of migratory river herring and American eels in rivers and streams across Long Island. This helps the public to become educated on alewife and motivated to get involved in monitoring and river connectivity issues in the Peconic Estuary.

On each site visit, the citizen scientist records the date, time, tributary/observation site name, GPS coordinates, tidal stage, water temperature. They then look for river herring and American eel presence, other species presence, estimation of the size of the spawning run, site photos and record any other interesting observations. The information from the survey can also submitted through an easy-to-use on-line application, Survey123 field app, via computer or mobile device and automatically becomes part of Long Island Volunteer River Herring and Eel Survey Database.
To volunteer for the river herring and eel surveys, email Barry Volson at barry.volson@stonybrook.edu
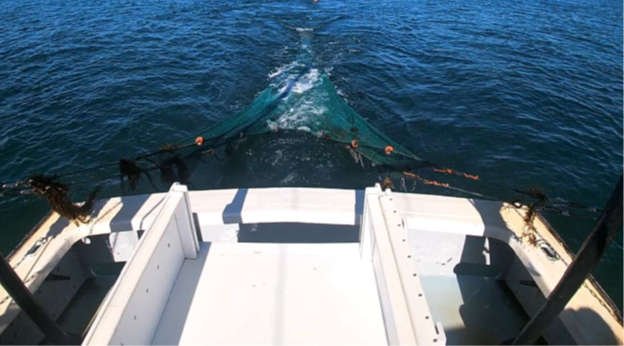
Marine and estuarine systems face a myriad of stressors ranging from eutrophication, habitat alteration, overfishing to climate change. Since 1987, the New York State Department of Environmental Conservation has conducted an extensive trawl survey in the Peconic Estuary. PEP and SBU partnered with NYSDEC analyze the spatial and temporal trends in the Peconic Estuary finfish trawl survey dataset and develop risk metrics from ecological relationships for the Peconic Estuary that examine whether local and regional environmental changes have increased the vulnerability of individual finfish and mobile invertebrate species, community assemblages, and ecosystem processes. This survey is carried out May through October with a 4.9-meter semi-balloon otter trawl. Sixteen stations are chosen weekly from a block grid of 77 units, each 1’ latitude by 1’ longitude in size. On average, 381 tows are collected each year. Assessing the vulnerability of species and communities to environmental change in the Peconic Estuary has direct application to decisions affecting the use, management, and conservation of the natural resources in the bay. Trawl survey data helps to satisfy the compliance requirements of interstate fishery management plans for New York. It informs a number of stock assessments for important finfish and crustacean species. It is used in the development of dredging windows to protect vulnerable species such as winter flounder. Stony Brook University uses the trawl data for Graduate and PhD research programs and projects. New York State Department of Environmental Conservation and Suffolk County also incorporate this information into their decision-making evaluating proposed locations for shellfish aquaculture in the Aquaculture Lease Program.
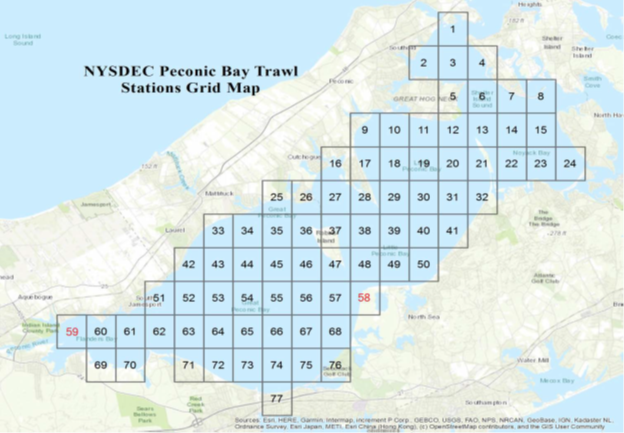
The trawls begin near the center of each randomly selected block as seen in the Map of Peconic Estuary trawl survey. Peconic Estuary Trawl Survey utilizes a 4.8 semi-balloon shrimp trawl with 3.8cm mesh in the body, 3.2cm mesh in the codend, and 1.3cm mesh in the liner. Fish and mobile invertebrates in the tows are identified, measured and counted, and environmental data (surface and bottom temperature, salinity, dissolved oxygen, tow start depth, GPS location and depth are recorded at the beginning and end of each tow, secchi disc depth) are recorded. Adult horseshoe crabs and blue crabs are tagged before release. Chlorophyll measurements are obtained from the Suffolk County Department of Health Services. Two climatic indices are also used in the Peconic Estuary Trawl Survey analysis, the Atlantic Multi-Decadal Oscillation Index (AMO) and the North Atlantic Oscillation Index (NAO) obtained from the National Oceanic and Atmospheric Administration.
Sign up for News, Events and Information straight to your inbox.